Analyse and monitor your energy consumption in real time

The first step towards performance: understanding your consumption profile
Create an accurate baseline of your fleet's energy efficiency, building by building, and obtain a detailed consumption profile to serve as a benchmark. As part of our management mission, we can then accurately measure the results of your daily actions and adjust your strategies to maximise your performance.
Why analyse your energy consumption?
To optimise, you first need to understand.
Energy consumption analysis is essential for:
- Identifying sources of waste
- Prioritising high-impact actions
- Complying with regulations (BCS Decree, Tertiary Decree, CSR, etc.)
- Meet performance targets
With the app.eficia.com energy monitoring platform, you can access clear, reliable data to understand how your buildings work and manage them efficiently.
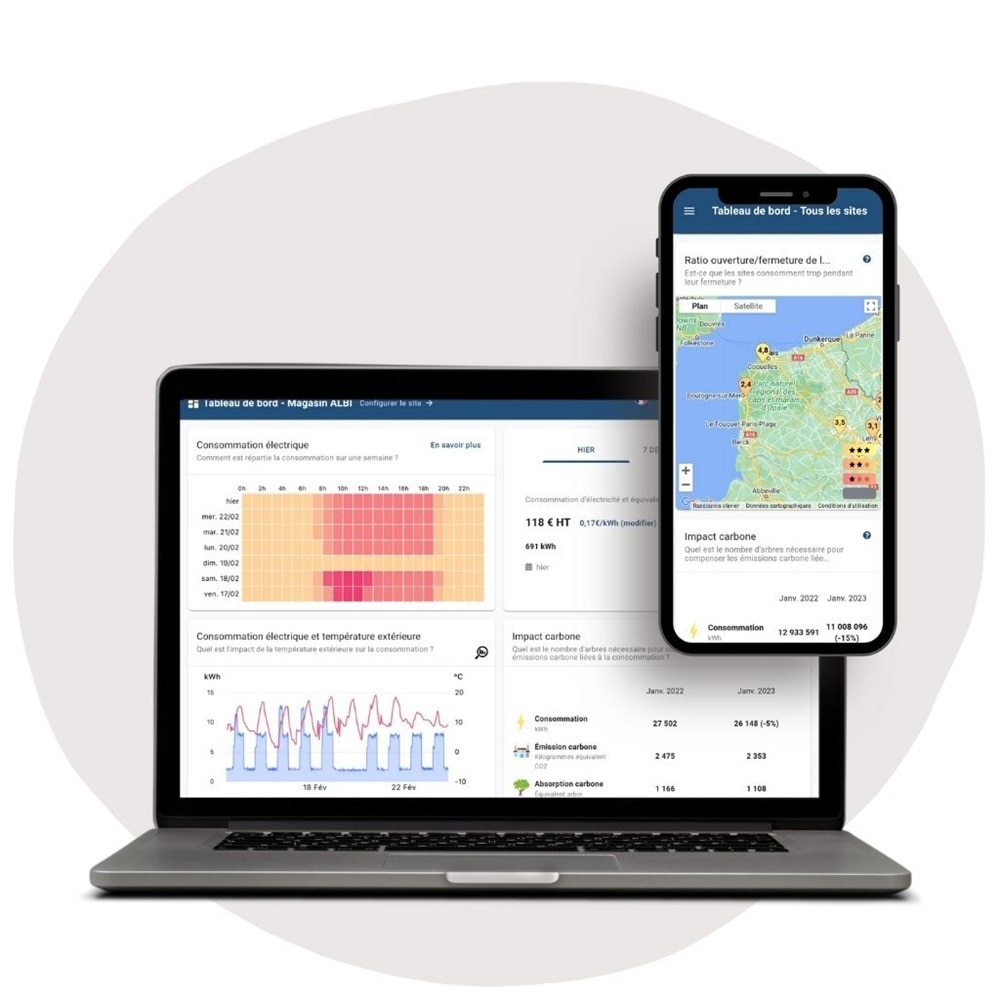
Real-time monitoring of your property portfolio
Track your key performance indicators with our comprehensive, powerful and intuitive monitoring tool.
Thanks to our monitoring platform, you can track all your building indicators in real time: consumption ratio, savings generated, carbon emissions, alerts, deviations, etc., all accessible from a simple web browser or directly on your mobile device (Web, iOS, Android).
‘With our monitoring tool, every piece of data becomes an opportunity for improvement. Transform the management of your fleet into a real energy performance accelerator.’
Data transformation
Our technology transforms raw data into a concrete lever for optimisation.
Our algorithms analyse, sort and retrieve key information about your property portfolio, enabling you to make quick and informed decisions.
With our monitoring tool, every piece of data becomes an opportunity for improvement. Transform the management of your property portfolio into a real driver of energy performance and consumption.
Anticipate anomalies before they become costly
Receive real-time alerts in the event of breakdowns
Identify energy optimisation levers
Optimise your energy contracts
Our energy monitoring app
An accessible tool for everyone that combines technology and simplicity
Eficia provides access to energy monitoring thanks to this platform, which allows you to:
- Real-time monitoring by centre, zone, park or equipment.
- Automated analysis of any anomalies and deviations from your targets.
- Customised reports tailored to your needs.
- Smart alerts for any energy excess or incident, so you can act quickly.
Access all these features from intuitive and accessible energy management software, on the web and via the mobile app.
-
How can you monitor energy consumption in real time?
Thanks to our monitoring tools, you benefit from a clear and instant view of your buildings' consumption, facilitating proactive management.
-
What are the advantages of Eficia's energy monitoring platform?
- Cost optimisation through detailed consumption analysis.
- Simplified management with automated alerts and reports.
- Better decision-making thanks to reliable and accurate data.
-
Is the app suitable for all sectors?
Absolutely! Our solution is ideal for building managers and operators in all service sectors (retail, offices, logistics, local authorities, etc.).